Bitcoin Tumbles Below $110K As Fear Grips Crypto Market
The Bitcoin price tumbled below $110k in the past 24 hours as fear gripped the crypto market for a second consecutive day.
The BTC price dropped a fraction of a percent to trade at $109,817 as of 12:40 a.m. EST, while the Crypto Fear and Greed Index edged up from 28 to 33 yesterday, still portraying a state of ”Fear” among investors as prices fell.
📈 Bitcoin's Potential Surge Tied to Fed Leadership Shift
Mike Novogratz suggests $BTC could hit $200,000 if the next Federal Reserve chair adopts a highly dovish monetary policy stance. The Galaxy Digital CEO views this potential leadership change as Bitcoin's "biggest bull… pic.twitter.com/icvjQVAIXV
— 👁 KOLYAN TREND | NFT and METAVERSE 👁 (@kolyan_trend) September 27, 2025
Still, a Bloomberg report that President Donald Trump has narrowed his shortlist for the next Federal Reserve chair to three candidates buoyed Galaxy Digital CEO Mike Novogratz, who said BTC may soar to $200,000.
“That’s the potential biggest bull catalyst for Bitcoin and the rest of crypto,” Novogratz said in an interview with Kyle Chasse.
A dovish stance from a new Fed chief would mean lower interest rates, and that would likely be a bullish catalyst for Bitcoin and other risk assets.
White House economic adviser Kevin Hassett, Federal Reserve Governor Christopher Waller, and former Fed Governor Kevin Warsh are the names on Trump’s shortlist to replace Jerome Powell at the Fed, Bloomberg reported.
With BTC dropping below the $110,000 support-turned-resistance, can the bulls take charge to push the asset to higher levels?
Bitcoin Price On The Verge Of A Breakout
The weekly chart for the BTC price reveals a strong long-term uptrend that has been intact since late 2023.
Bitcoin price action shows consistently higher highs and higher lows, with the latest candles consolidating just above the 0.236 Fibonacci retracement level around $107,500. This zone has acted as a critical support area, preventing deeper corrections.
Examining the major indicators, the 50-day Simple Moving Average (SMA) on the 1-week chart is positioned well below the current price, indicating a healthy bullish structure.
With the price of BTC remaining comfortably above these levels, it signals strength in the trend. The Fibonacci retracement levels provide key zones of interest, with the 0.382 level at $97,274 and the 0.5 level at $88,997 serving as potential downside supports if the market experiences a pullback.
Meanwhile, the Relative Strength Index (RSI) sits at 53, a neutral reading that suggests neither overbought nor oversold conditions. This balance often provides room for further upside without immediate risk of exhaustion.
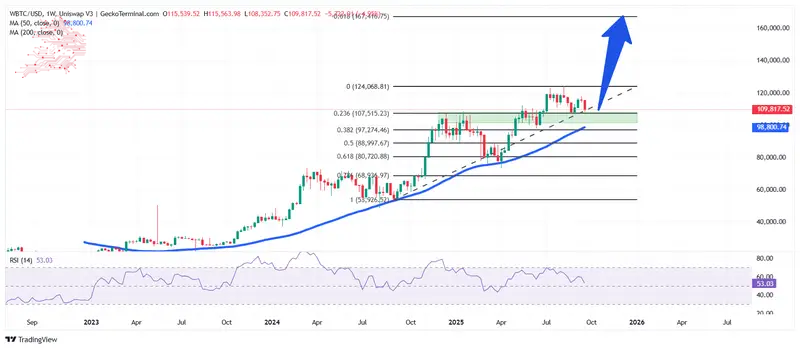
Based on the current setup, the price of Bitcoin appears to be building a base for another leg higher. If the $107,500 level holds, BTC could surge to the next Fib target at $160,000, having cleared its all-time high (ATH) above the $124,000 zone.
This comes as Eric Trump believes that Bitcoin could surpass the $1 million level in Q4.
🇺🇸 ERIC TRUMP SAYS “ I THINK BITCOIN WILL SURPASS $1,000,000 AND Q4 OF THIS YEAR WILL BE UNBELIEVABLE " 🚀 pic.twitter.com/Fh4cZfs0dZ
— Ash Crypto (@Ashcryptoreal) September 26, 2025
Conversely, if the price of Bitcoin drops below the $107,500 support, the next cushion against downward pressure could be around the 50-day SMA at $98,800 and near the 0.382 Fib level ($97,274).
Related News:
- Bitcoin Bear Peter Schiff Warns Of Crypto ‘Ice Age,’
- Citi Says Stablecoin Market To Soar 13x By 2030 To $4 Trillion In Revised Forecas
- Ethereum Whales Scoop Up $1.6B ETH Amid Co-Founder Sale Speculation


Comments
Post a Comment