Polygon Price Risks Decline As It Encounters Rejection At $0.80

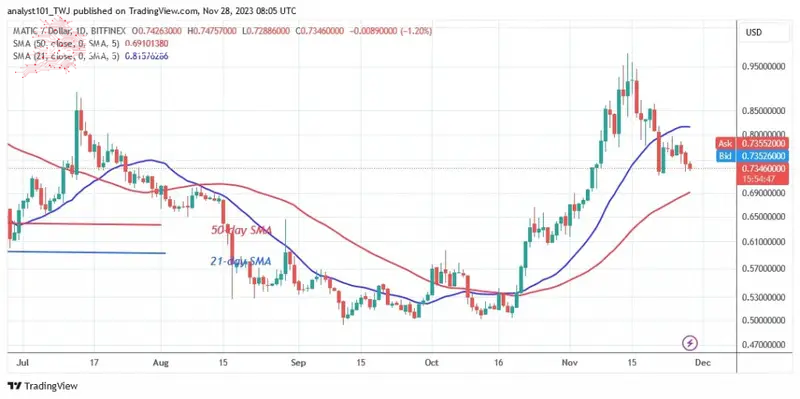
The price of Polygon (MATIC) has fallen within the moving average lines. The cryptocurrency fell below the 21-day SMA and the $0.80 support before retesting the $0.80 high.
Polygon price long term prediction: bearish
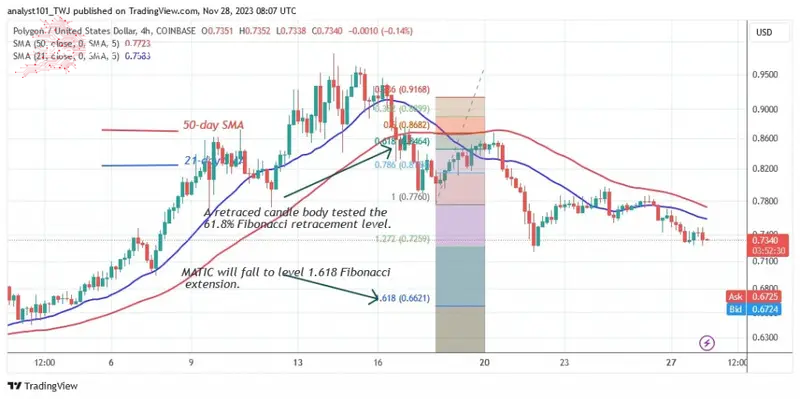
The break below the 21-day SMA followed by a correction suggests that selling pressure will continue to be on the downside. On the downside, Polygon will drop to a low above the 50-day SMA or $0.66.
If the cryptocurrency remains above the 50-day simple moving average, the slide will be halted. A sideways trend will resume between the moving average lines. At the time of writing, MATIC/USD is trading at $0.73.
Analysis of the polygon indicator
The polygon indicator is falling below the 21-day simple moving average. The decline will continue until it reaches the 50-day simple moving average. The 50-day SMA support is the point where the sideways trend will start if it holds. Selling pressure will increase if the price of the cryptocurrency falls below the moving average lines.
Technical Indicators
Resistance Levels: $1.20, $1.30, $1.40
Support Levels: $0.60, $0.40, $0.30

What is the next move for Polygon?
The cryptocurrency is continuously sliding and reached a low of $0.73. The predicted price level for MATIC will be reached if the current support level of $0.72 is broken. The cryptocurrency is expected to reach the 1.618 Fibonacci extension or $0.66.
On November 21, Coinidol.com reported that the bearish momentum was repeating itself and the market price of MATIC was $0.80.

Disclaimer. This Analysis and forecast are the personal opinions of the author and are not a recommendation to buy or sell cryptocurrency and should not be viewed as an endorsement by CoinIdol.com. Readers should do their research before investing in funds.
Comments
Post a Comment