Cardano price prediction after whale activity explodes
As Bitcoin (BTC) struggles to stabilize after the BTC halving, the wider cryptocurrency market still feels the impact.
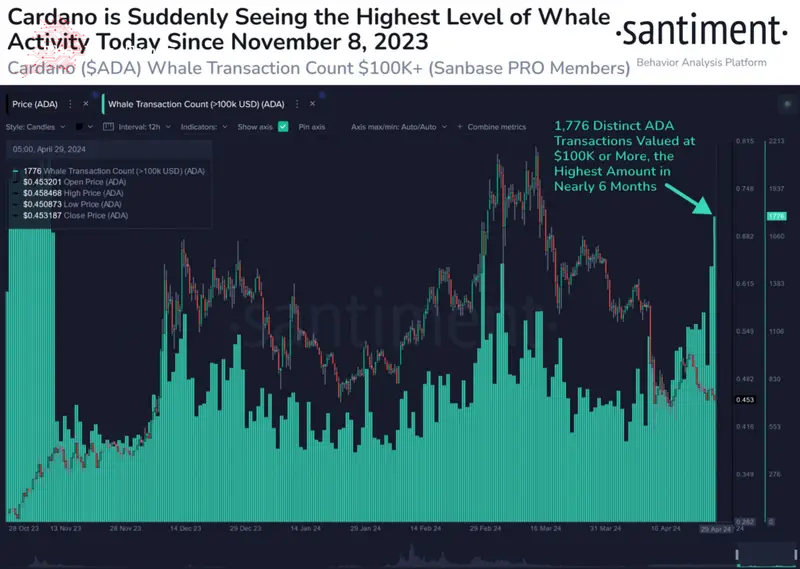
Although its price hasn’t performed particularly well in recent days, Cardano (ADA) is seeing a notable increase in whale activity.
According to cryptocurrency tracker Santiment, on April 29, ADA experienced a significant surge in whale transactions, surpassing $100,000.
Picks for you
Specifically, 1,776 transactions of that amount or more have been recorded as the highest count in almost six months.
This uptick in whale activity is historically linked to potential price reversals. It’s especially noteworthy given that ADA’s market cap has plummeted by a staggering 43% since March 13.
Cardano technical analysis
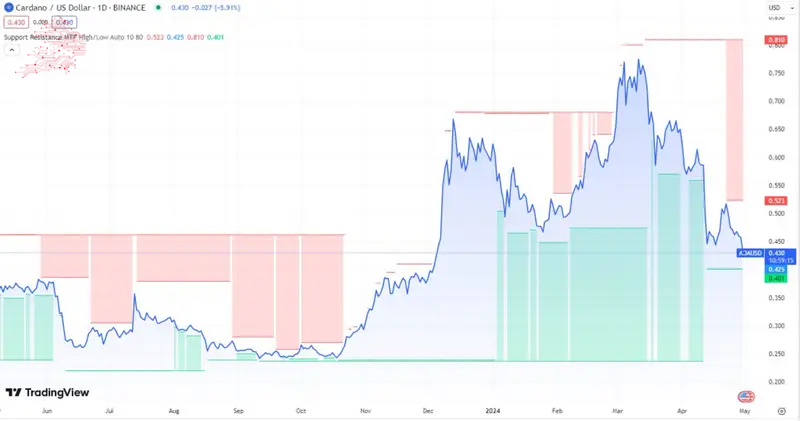
In the medium to long term, Cardano has breached the lower boundary of an ascending trend channel, suggesting either a slower rate of ascent initially or the beginning of a more horizontal trend.
Currently, ADA is testing resistance at the $0.46 level. While this might trigger an adverse reaction, a breakthrough above $0.46 could signal a positive trend.
Additionally, the negative volume balance indicates that trading volume is higher when prices fall, signaling diminishing investor optimism on the whole.
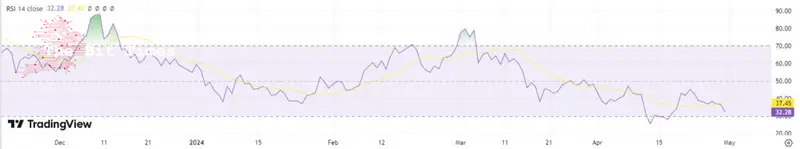
The currency’s short-term momentum is negative, with the Relative Strength Index (RSI) at nearly 30. This indicates that investors consistently sell at lower prices, reflecting growing pessimism and sustained downward pressure despite the large-scale whale transactions.
Cardano price chart
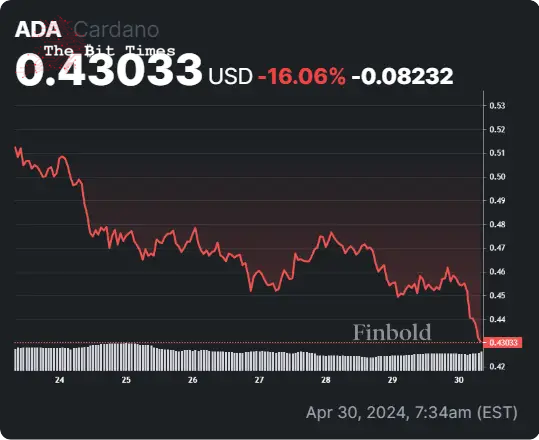
ADA is currently trading at $0.430, marking a 5.48% loss in the last 24 hours and extending a retracement of 16.06% over the past week.
The negative trend has persisted over the last 30 days, with Cardano losing 33.53% of its value.
Given the predominantly bearish technical indicators for ADA and its substantial pullback over the past month, it’s challenging to anticipate a notable increase in ADA’s value in the short term despite this large scale purchasing by a small minority.
Disclaimer: The content on this site should not be considered investment advice. Investing is speculative. When investing, your capital is at risk.


Comments
Post a Comment