BlackRock back to buying this crypto, spends $27 million
BlackRock (NYSE: BLK) has resumed accumulating Ethereum (ETH), reversing earlier signs that the world’s largest asset manager was scaling back exposure on the second-ranked cryptocurrency.
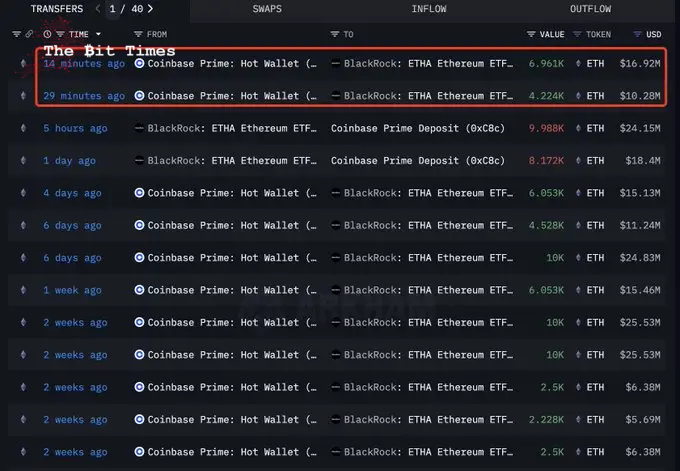
Specifically, BlackRock withdrew over 11,000 ETH, worth approximately $27.2 million, from Coinbase Prime, according to blockchain data from Arkham Intel on June 24.
The transfers came in two parts. The first one emerged at 10:43 UTC and involved 4,224 ETH worth $10.28 million, followed 15 minutes later by 6,961 ETH valued at $16.92 million.
Both transactions originated from Coinbase Prime’s hot wallet and were sent to a wallet tied to BlackRock’s Ethereum ETF (ETHA).
BlackRock’s initial signal to sell ETH
The move is especially noteworthy given that just a day earlier, on June 23, BlackRock transferred 9,928 ETH worth around $24.15 million from its ETF wallet to Coinbase Prime, sparking speculation of profit-taking or rebalancing. However, the swift reversal suggests a renewed accumulation strategy.
This marks one of BlackRock’s largest Ethereum purchases in recent weeks. Just days earlier, on June 20, the firm’s spot Ethereum ETF recorded a $19.7 million outflow, the first after 30 consecutive days of inflows.
That outflow was also the largest among all Ethereum ETFs, contributing to a net market outflow of $11.3 million.
BlackRock’s renewed buying comes amid a broader rebound in institutional crypto activity, following a market-wide selloff driven by Middle East geopolitical tensions.
However, markets turned bullish on Monday after President Donald Trump announced a ceasefire between Israel and Iran, helping Bitcoin (BTC) reclaim the $105,000 level.
Ethereum price analysis
As of press time, Ethereum was trading at $2,444, up over 6% in the past 24 hours but still down nearly 2% over the past week.
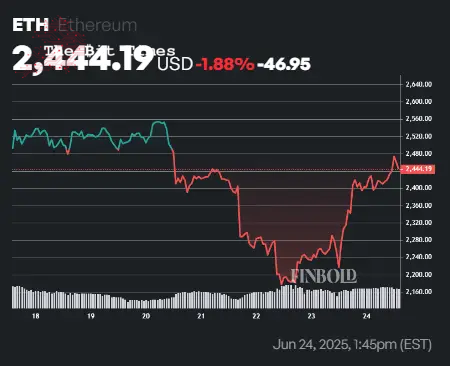
Technically, Ethereum’s outlook remains mixed. The asset is trading below its 50-day simple moving average (SMA) of $2,526.24, indicating short-term weakness but still above the 200-day SMA at $2,364.00, signaling a longer-term bullish bias.
Meanwhile, the 14-day relative strength index (RSI) stands at 46.58, reflecting neutral momentum in line with overall market sentiment.
Featured image via Shutterstock


Comments
Post a Comment